The Chart That Remembers What mistakes you did , its frequency and impact on your P&L
Hey everyone!
Okay, confession time. Last month I caught myself doing the EXACT same stupid thing I did in January. And February. And March.
You know what I'm talking about, right?
That moment when you're like "Oh crap, I'm revenge trading again" or "Why did I just ignore my stop loss... AGAIN?!"
We're all guilty of this:
Making the same mistakes
Forgetting we made them
Promising ourselves "never again"
Then doing it next week
It's embarrassing. But it's human.
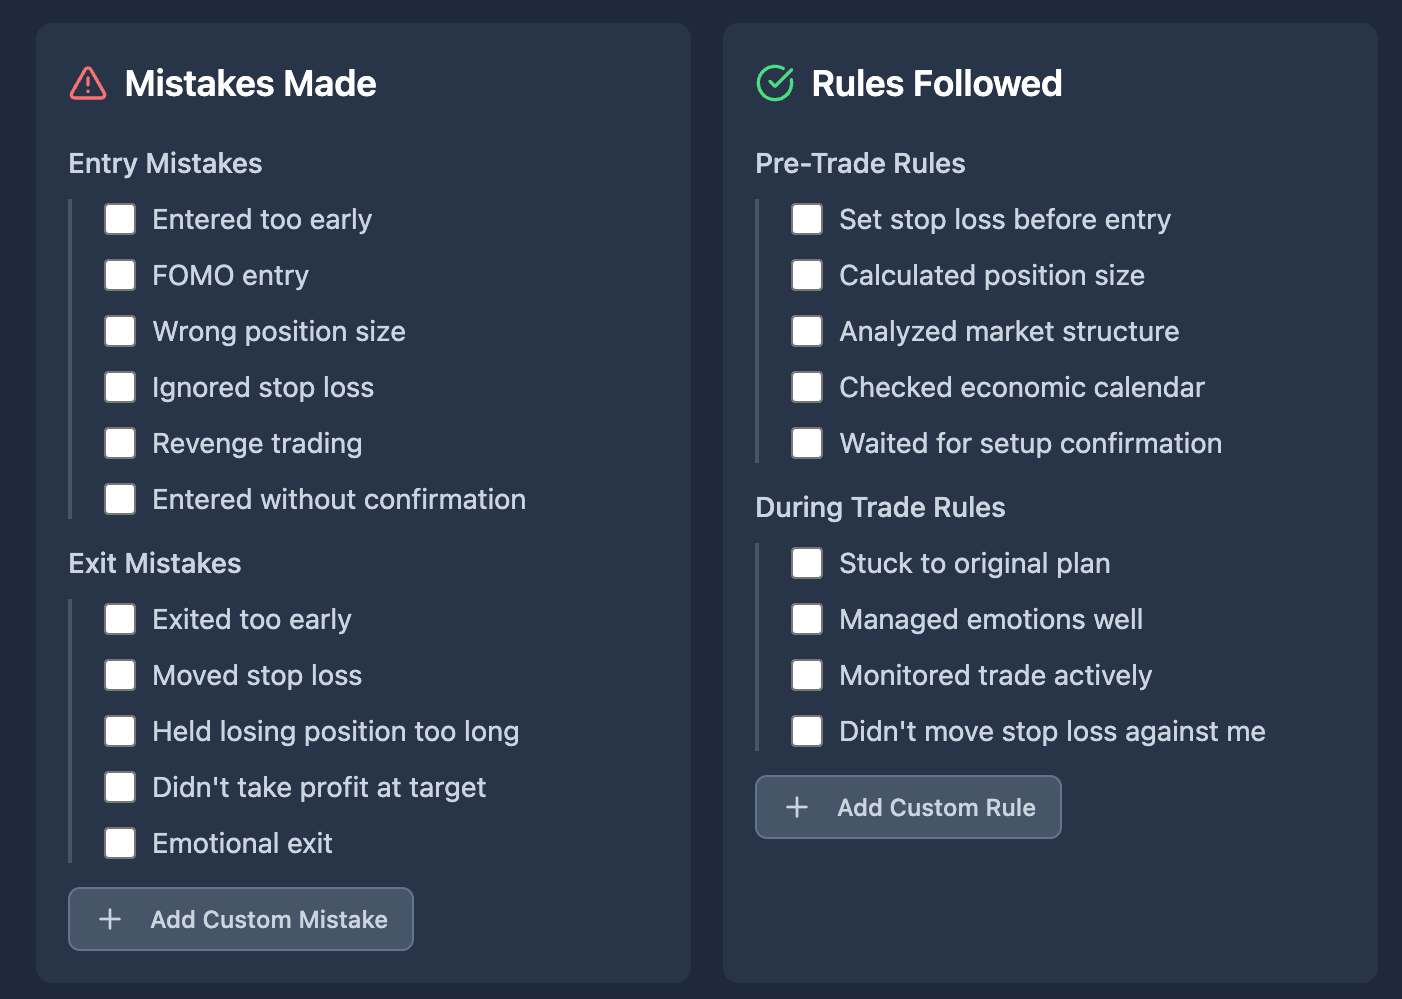
So I built something that doesn't let me forget:
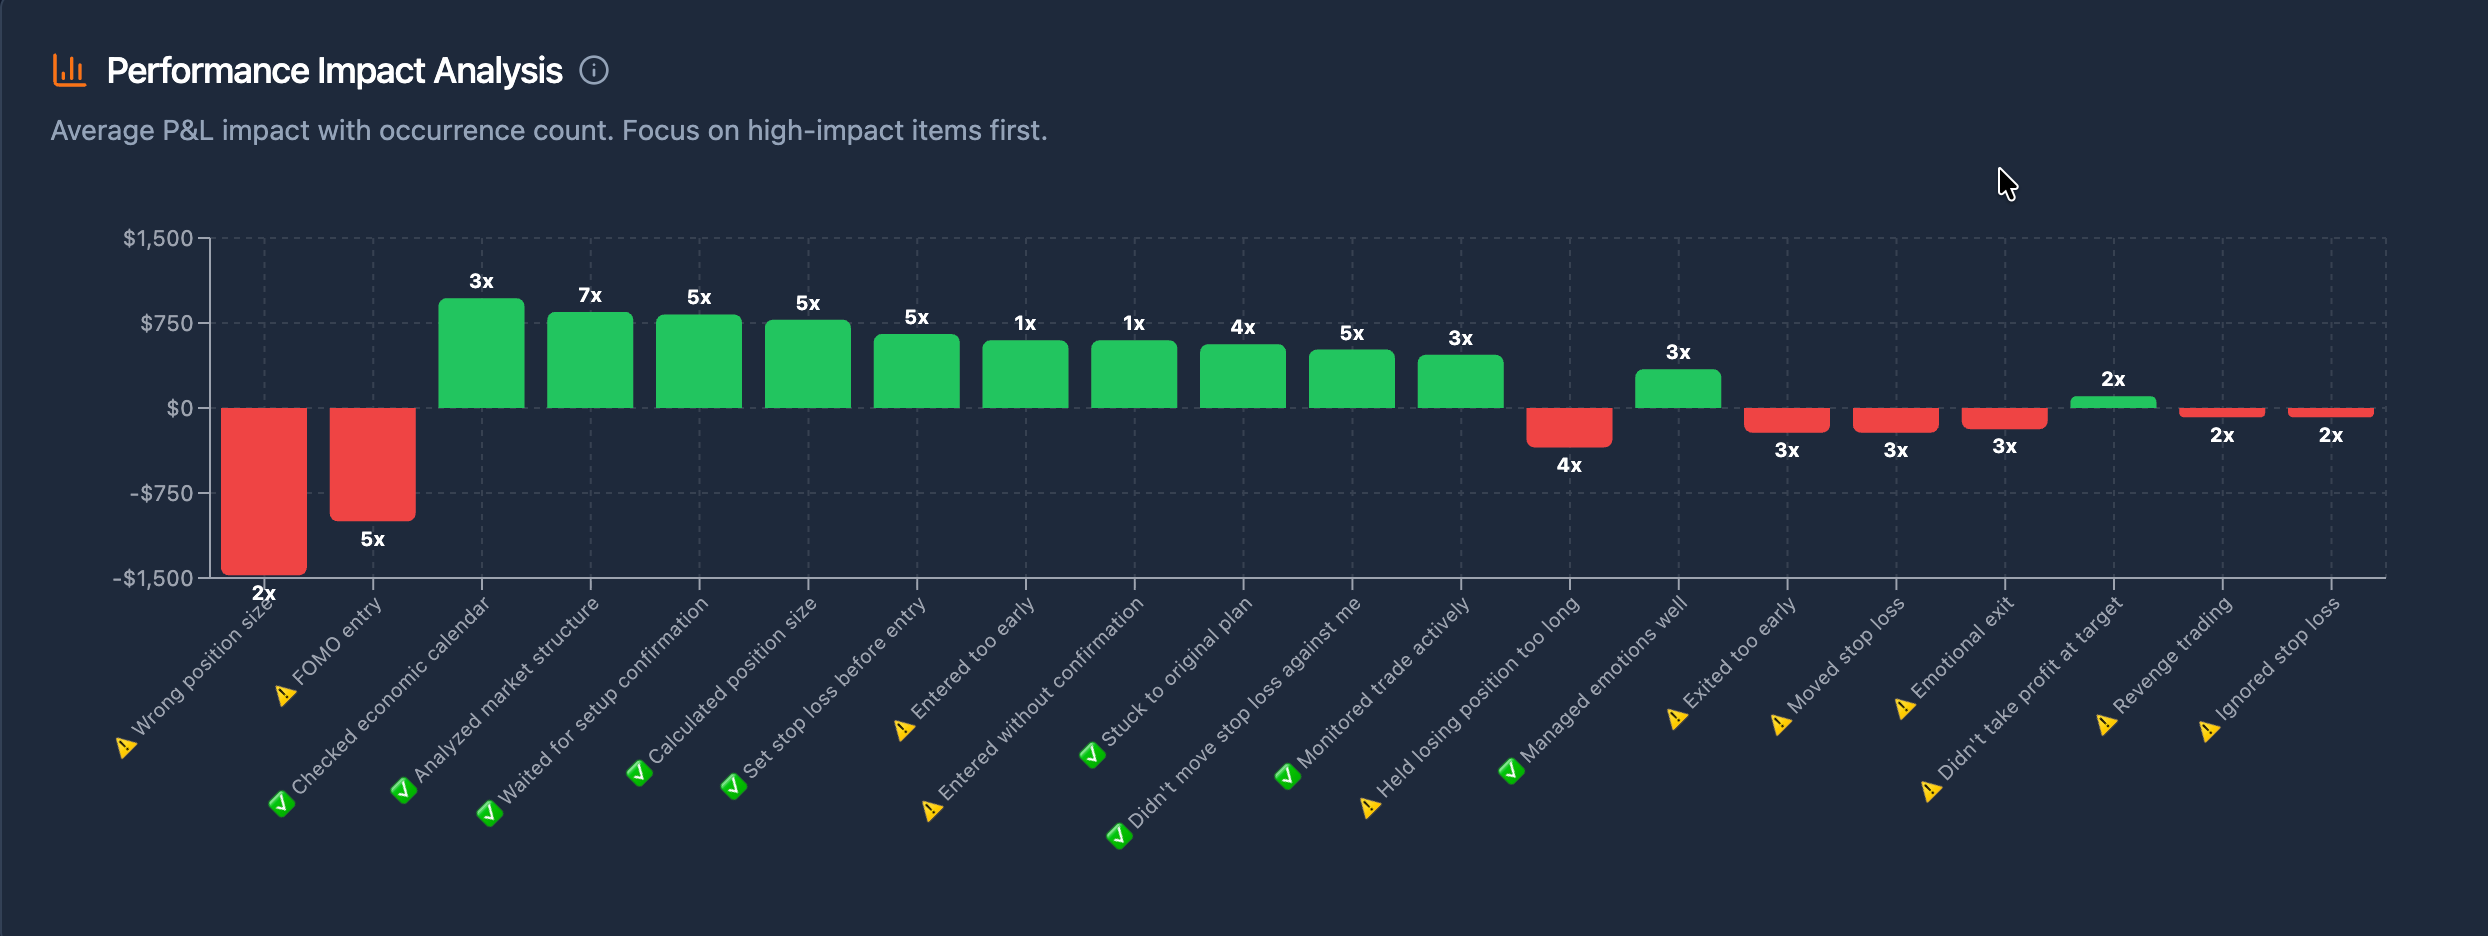
Performance Impact Analysis - basically a chart that keeps score of all my dumb decisions.
What it shows me:
How many times I've revenge traded (spoiler: too many)
What each mistake actually cost me in dollars
Which bad habits are bleeding me the most
The reality check:
Seeing "Emotional Decision - 8x" with a big red -$1,200 bar? That hurts more than any lecture.
But it works. Because you can't lie to yourself when the data is right there.
Why I'm sharing this:
Look, we all mess up. The difference between profitable traders and everyone else? We track our mess-ups and actually learn from them.
This chart doesn't judge. It just shows you the facts. Then it's up to you to do something about it.
Fair warning:
Your first look might be brutal. Mine was. I had no idea I was making the same 3 mistakes over and over.
But that's when real improvement starts.
Go check yours out. It's in Trading Insight section.
And hey, if it looks bad - at least now you know what to work on
Please authenticate to join the conversation.
Completed
Feature Request
8 months ago

My PnL
Subscribe to post
Get notified by email when there are changes.
Completed
Feature Request
8 months ago
My PnL
Subscribe to post
Get notified by email when there are changes.