Confidence vs Performance Visualisation , win rate , avg P&L , and number of trades
Hey traders!
Ever had one of those days where you felt like a trading god... right before losing your shirt?
Yeah, me too.
1. The Pain Point (We've All Been There):
You know that feeling when you're absolutely CERTAIN a trade will work? You size up big, maybe even go all-in, because "this one's a sure thing."
Then it crashes. Hard.
The worst part? It happens when you're feeling most confident. Like the market has a personal vendetta against your ego.
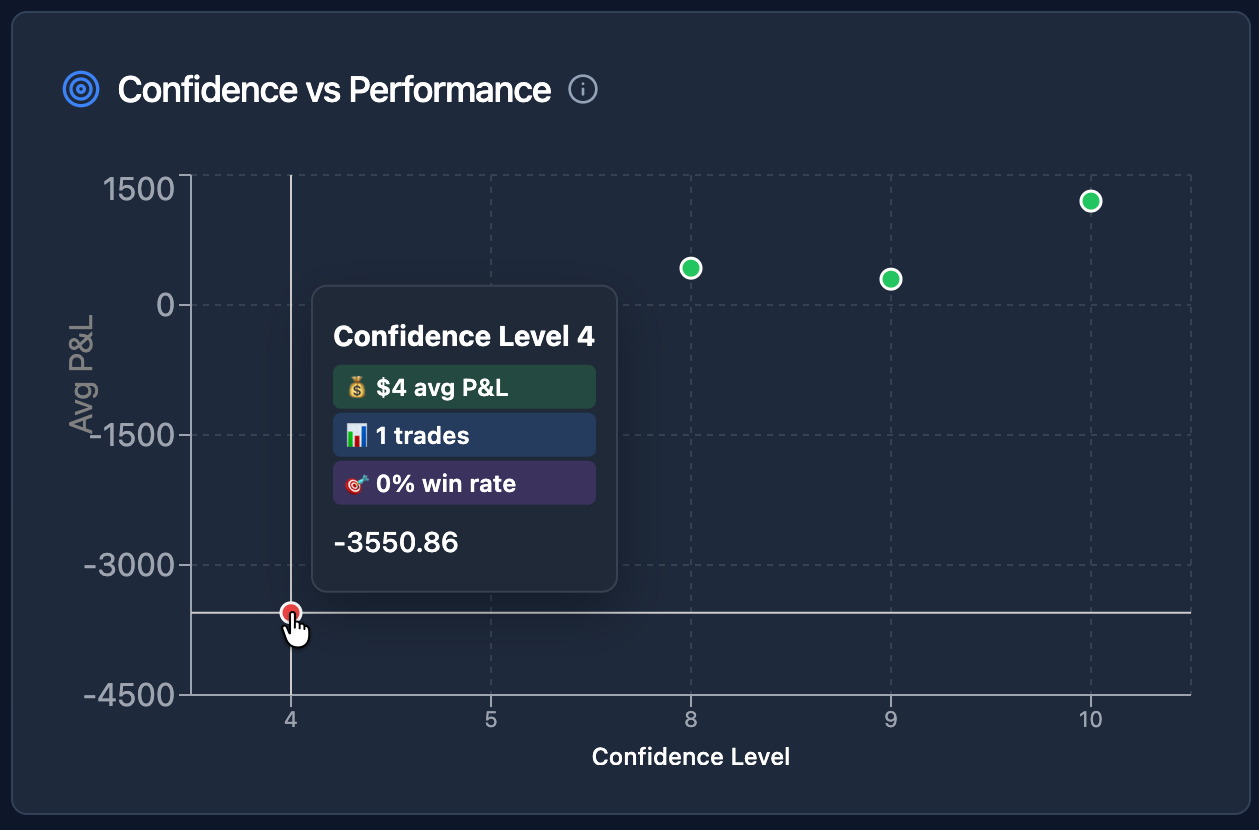
2. How This Chart Works:
Confidence vs Performance tracks something nobody talks about - the relationship between how sure you felt and how much you actually made.
X-axis: Your confidence level (1-10 scale)
Y-axis: Your actual P&L results
Each dot: A trade, positioned exactly where your confidence met reality
3. The Brutal Truth It Reveals:
High confidence, big losses = You're overconfident (red dots on the right, bottom)
Low confidence, good profits = You're underestimating yourself
Sweet spot = Where your confidence actually matches your results
4. How to Improve Your Trading:
If you see high confidence + losses:
Start questioning your "sure thing" setups
Reduce position sizes when you feel overly confident
Maybe your best setups aren't what you think they are
If you see low confidence + profits:
Trust your instincts more
Size up on trades you're unsure about (counterintuitive, right?)
Your hesitation might be picking up on something good
The goal: Get your dots clustered where high confidence = high profits.
5. My Personal Wake-Up Call:
When I first saw my chart, I had a cluster of dots at confidence level 9-10 with massive losses. Turns out, my "best" setups were actually my worst.
My profitable trades? Confidence level 5-6. The ones I was hesitant about.
That changed everything. Now when I feel super confident, I actually size DOWN. Weird, but it works.
6. The Psychology Behind It:
Overconfidence kills more trading accounts than bad analysis. This chart makes it visible.
It's not about being right or wrong. It's about calibrating your confidence to match your actual edge.
Real Talk:
This feature took forever to build because tracking confidence levels seemed "soft." But emotions drive trading more than technicals ever will.
Now I log my confidence before every trade. It's become my secret weapon for position sizing.
Check yours out - you might be surprised what you find!
Please authenticate to join the conversation.
Completed
Feature Request
8 months ago

My PnL
Subscribe to post
Get notified by email when there are changes.
Completed
Feature Request
8 months ago
My PnL
Subscribe to post
Get notified by email when there are changes.